
Natural Disasters and Elective Medical Services: How Big is the Bounce-Back?
Natural Disasters and Elective Medical Services: How Big is the Bounce-Back?

Natural Disasters and Elective Medical Services: How Big is the Bounce-Back?
Author: Tatyana Deryugina
Author: Jonathan Gruber
Author: Adrienne Sabety
Abstract: COVID-19 has created a dual set of stresses on health care systems worldwide: a rise in expensive intensive care services and a dramatic decline in elective services. The U.S. government has responded with both grant and loan programs to help health care providers weather the storm. But the optimal size and nature of such programs are hard to evaluate without an understanding of the ability of providers to make up their lost elective service revenues over time. In this paper, we study the closest relevant parallel to the reduction in elective services seen under COVID-19: hurricanes. We match information on hurricanes to data on Medicare hospital elective visits and charges from 1997-2013, comparing counties impacted by hurricanes to nearby unaffected counties. We find that the average hurricane reduces elective services by about 7% in the month it makes landfall. For the most severe hurricanes, we estimate a reduction of more than 20%. Services return to baseline fairly rapidly, but for severe hurricanes it takes a year or more to make up lost revenues. Projections based on variation in hurricane severity suggest that it will take over 3 years for providers to make up the lost revenue from COVID-19.
Date: 2020
Date Added: 11/2/2021, 11:16:08 AM
Reading Notes:
Objective: To estimate the effect of hurricanes on hospital elective care visits, both temporarily & permanent
Importance: National disaster damage is growing faster than GDP. We know little about how disasters affect the healthcare system. Understanding this will help inform optimal disaster aid
Background: 1997 was a quiet year for hurricanes, so used as baseline
Data & Key Variables:
Medicare data 1997-2013: 100% of inpatient admissions & outpatient claims (2 billion observations). Restrict to elective services. Total charges, procedures, & visits at county-month level
Tropical Cyclone Extended Best Track Dataset 1997-2012: location of storm center, wind speed, radius of maximum wind.
Remove New Orleans and Galveston, TX from sample
Methodology: Difference-in-differences comparing counties that experienced a hurricane vs those that didn't. Hurricane strength measured at hurricane*county level.
Event-study to visualize dynamics
Results: The time it takes a hospital to recoup lost revenue from a hurricane differs by the strength of the hurricane.
An average hurricane reduces elective services by around 7% in month of hurricane. 20% for a large hurricane
Key Table/Figure:
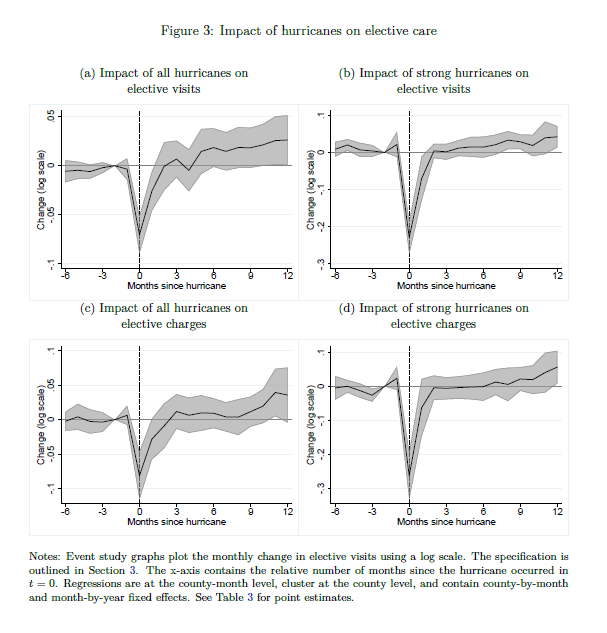
Chart of the Day post: